

Top 10 Must Know Evaluation Metrics for Data Scientists and Machine Learning Professionals
- vikash Singh
- Jan 2
- 4 min read

In the world of machine learning, building a great model is only half the battle. The remaining 50% is to figure out if your model is actually any good or not?
That’s where evaluation metrics come in….

Whether you’re working on regression or classification problems, understanding the right metrics is crucial to making sure your model isn’t just running wild.
In this guide, you’ll learn about the most popular and widely used top 10 evaluation metrics in supervised machine learning — for both regression and classification algorithms.
Part 1: Regression Model Evaluation Metrics
Okay, so we’ll start with regression.
Regression models are those models in which the target variable is a numerical one. For example, predicting revenue of a retail store, covid deaths, or salary, etc.
Regression metrics help us understand how well our regression models are performing, so let’s break them down one by one.
1. Mean Absolute Percentage Error (MAPE)
MAPE measures the mean absolute percentage error between the predicted and actual values. It’s a popular metric because it’s easy to interpret in percentage terms.

Illustration Example: For 3 predictions:
Actual values: [100, 150, 200]
Predicted values: [90, 160, 210]

This comes out to be 7.2%
2. Root Mean Squared Error (RMSE)
RMSE (Root Mean Squared Error) is a way to measure how far off your model’s predictions are from the actual values.
It takes the differences between predicted and actual values, squares them (to get rid of any negatives), finds the average of those squares, and then takes the square root to bring it back to the original scale.
Sounds a bit complicated, don’t worry, it will be pretty clear once you have a look at the formula below and the sample calculations.

Example Calculation: Using the same actual and predicted values:
Actual values: [100, 150, 200]
Predicted values: [90, 160, 210]

This comes out to be 10. In simple terms: RMSE tells you how much your predictions are “off” on average.
The lower the RMSE, the better your model is doing at making accurate predictions. It’s like your model’s report card, and you want a nice low score!
One unique thing about RMSE is that it penalizes larger errors more than smaller ones. It’s a great way to spot big mistakes in your model.
3. R-squared (R²)
R-squared is like a “goodness of fit” score for your regression model. It tells us how much variance in the dependent variable is explained by the model.
The value ranges from 0 to 1, where 1 means your model explains all the variation, and 0 means it explains none of it.

Where:
SSres is the sum of squared residuals
SStot is the total sum of squares
4. Adjusted R-squared
Adjusted R-squared accounts for the number of predictors in your model. It works by penalizing your model for including unnecessary features, so it gives you a better idea of how good your model really is.

Where `n` is the number of data points, and `p` is the number of predictors.
5. Mean Absolute Deviation (MAD)
Mean Absolute Deviation (MAD) is a simple way to measure how far off your model’s predictions are from the actual values, on average, and in absolute terms.
To calculate it, you take the difference between each predicted and actual value, ignore whether it’s positive or negative, and then find the average of all those differences.

So here you have it! These are the most popular evaluation metrics for regression models. There are of-course many more metrics, but these are the most widely used ones.
Part 2: Classification Model Evaluation Metrics
Classification models are used when the target variable is categorical, meaning it falls into distinct groups or classes.
For example, instead of predicting a number, you’re predicting categories like whether an email is spam or not, if a customer will buy a product or not, or identifying the species of a flower.
The evaluation metrics for classification models help us understand how well our models are performing.
6. Confusion Matrix
First up, the confusion matrix. It’s a simple yet powerful way to visualize the performance of a classifier.
Example Confusion Matrix:

Where:
50 = True Positives (TP): These are the cases where the model correctly predicted something as positive, and it was actually positive. Think of them as the “correct hits.”
10 = False Positives (FP): These are cases where the model predicted something as positive, but it was actually negative. These are “false alarms.”
5 = False Negatives (FN): These are the cases where the model predicted something as negative, but it was actually positive. It missed something important, like “missed opportunities.”
35 = True Negatives (TN): These are the cases where the model correctly predicted something as negative, and it was actually negative. These are the “correct rejections.”
Each of these helps you understand how well your model is doing at classifying things correctly!
How?
Let’s understand it in subsequent sections:
7. Accuracy
Accuracy is how often your model correctly predicts the outcome.

Example Calculation:

8. Precision
Precision tells you how many of your positive predictions were actually correct.
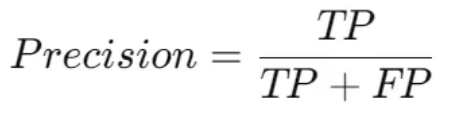
Example Calculation:

9. Recall (Sensitivity)
Recall tells you how many of the actual positives were correctly identified by your model.
This is an important metric in case of imbalanced data, where the positive class is at a minority, and that is when this metric becomes super critical.

Example Calculation:

10. F1 Score
F1 score balances precision and recall. It’s useful when you need a balance between the two. This is one of the metrics which is useful when dealing with imbalanced dataset.

Example Calculation:

There you have it!
The top 10 evaluation metrics that every data scientist and machine learning professional should know.
Here are the key takeaways:
Regression Metrics: MAPE, RMSE, R-squared, Adjusted R-squared, and MAD.
Classification Metrics: Confusion matrix, accuracy, precision, recall, and F1 score.
Application: These metrics help data scientists and machine learning professionals understand model performance, identify weaknesses, and improve the accuracy and fairness of predictions.
If you are interested in more such tutorials on :
data science, machine learning and AI,
career counselling, career guidance and mentorship,
business strategy and start-up advisory / planning
Please follow the site and subscribe to it.
You can also connect with me on LinkedIn.


Comments